Understanding metrics and KPIs can be the key to success for your retail business. They give you the insight you need to make better business decisions. We asked the experts at Grow to share everything you need to know about metrics and KPIs.
We are excited that Brightpearl has invited us to share some insights into metrics, KPIs, data visualizations and why it matters. This blog takes a look at the difference between the two, what key indicators you should look out for, and how using dashboards can bring your metrics to life.
What’s the difference between metrics and KPIs? What do they even mean? — and how it can make all the difference for your business
Ever felt a little bit lost when hearing about “Business Intelligence”? You’re not alone if at some point you’ve ever wondered what people mean by “KPI”, “metrics”, or “analytics”. With so many businesses and news outlets offering advice on how to use data, the BI corner of the web is teeming with this kind of industry jargon.
To add insult to injury, it’s fairly common to see some of these terms used interchangeably. The problem is, they aren’t the same—and using them correctly does make a difference.
Change your perspective
The way we use words changes the way we think about and understand them. So using these BI terms interchangeably not only can create confusion, it can actually be bad for business.
To harness the full power of your data, it’s important to understand the relationship between KPIs and metrics, and how to use them. That’s why we’re setting the record straight, once and for all.
Metrics vs. KPIs
Metrics and KPIs are like squares and rectangles: All squares are rectangles, but not all rectangles are squares. So while all KPIs are metrics, not all metrics are KPIs. Clear as mud? Let’s dig a little deeper…
Business metrics
Metrics, sometimes called business metrics, are quantifiable measures used to gauge performance or progress. To create a metric, you take data from a live source (i.e., it’s still updating with new information) and monitor it to track progress toward a business objective.
For example, if one of your goals is to get 100k in monthly sales, you can take raw POS or eCommerce data from Brightpearl and track individual sales to measure progress toward your goal. In other words, “Monthly Sales” becomes one of your metrics.
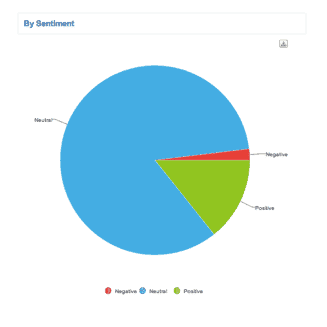
Data sources can also be qualitative, such as when you’re an early stage startup trying to find product-market fit. In that situation, your data source may be customer interviews where you track responses about what they like or dislike about your product. Your metric then could be the ratio of positive vs. negative sentiment, or a list of necessary improvements, because these help you understand your progress toward product-market fit.
Key performance indicators, or KPIs
So what metrics should be KPIs? The difference really depends on your business. Here’s why:
KPI stands for “key performance indicator.” By definition, not every metric you measure can be “key”—if they’re all special, none of them really are. So it’s up to you to choose metrics that are most closely aligned with your critical business objectives. This subgroup of metrics become your KPIs.
Learn which important operational KPIs you should be tracking.
This leads us to another important point: Not everything that your business ends up tracking and measuring will be an accurate indication of performance.
For example, while you certainly want to track metrics like your number of Facebook likes and see it improve, that metric won’t tell you how well you’re managing your business. (Heck, unless your marketing team just ran an email campaign with the specific goal of getting more followers on Facebook, it likely won’t tell anyone much about anything.) Metrics like these are often called “vanity metrics.” They’re easy to get hyped-up about, but provide very little insight into your business. In short, they’re a big “no-no” (they get the axe when it comes to selecting KPIs
One easy way to think of KPIs is like your company’s vital signs—if your business’s pulse is flatlining, you shouldn’t be fretting over zits. KPIs dial in your focus on the things that matter most to keep your business alive and well. Remember though, it’s ultimately up to you to define which metrics are true vital signs for your business.
Why you need to track both KPIs and Metrics
Just because your KPIs are your most important metrics doesn’t mean the rest of your metrics are obsolete. When one of your KPI vital signs goes haywire, you need to be able to look at other metrics to properly diagnose the problem.
Let’s say inbound leads is one of your KPIs, and that number suddenly takes a nosedive. While the KPI tells you there’s a problem, your other metrics will help you figure out what happened. Maybe it’s because there are broken links on your website, or there’s an error blocking leads from pushing to your CRM, or Facebook changed their algorithm and killed your most highly-converting ads. To identify the root cause, you’ll have to look at metrics such as site conversions, CRM data, ad impressions and clicks, etc.
Managing metrics and KPIs with a dashboard
We recommend using a data dashboard from Grow to manage your metrics and KPIs. Dragging data from dozens of apps into an Excel spreadsheet isn’t just a colossal waste of time; it creates reports that are hard to make, hard to read, hard to understand, quickly outdated … and pretty ugly (to be brutally honest). Plus, you have to deal with the headache of creating them on a regular basis.
On the other hand, Grow’s data dashboards bring your metrics to life with beautiful visualization (much better than endless spreadsheet cells). They also allow you to create specific KPI-only dashboards to stay focused. It’s an extremely effective way to drive your business decisions and accelerate growth.
We recommend using Brightpearl to manage orders, inventory, customer data, accounting, etc., then set up an account with Grow to track your most important KPIs and Metrics. Together these two platforms let you easily manage your company to success.
We are working with Brightpearl on building out an integration that will allow mutual customers to create beautiful metrics and dashboards with Brightpearl data, and correlate the data with data from other systems, databases, business apps, etc.
Check out Grow’s free eBook “The Data-Driven Marketing Essential Dashboard Guide” to learn how you can get your data working for you today!


